You still have time to improve your career in 2024!
- Stop doing repetitive and manual tasks in Excel
- Create interactive dashboards
- Be more productive and optimize your time
- Become a desired professional in the market
Exclusive Bonuses for this group of Jul/2024
Exclusive Bonuses for this group of Jul/2024

01: Introduction course to Figma – UX Design
Impress your boss and your clients with beautiful backgrounds from the best free professional tool in the market!

02: Premium Library of Background Templates
Exclusive collection of templates on PowerPoint (10 projects) from different areas for you to get inspired and use them in your own projects.

03: Cracking Recruitment Processes
Discover what the top firms want to read from your CV and how to behave in Professional Interviews. Get directions from Top Notch Consultants

04: Introduction to Power Automate
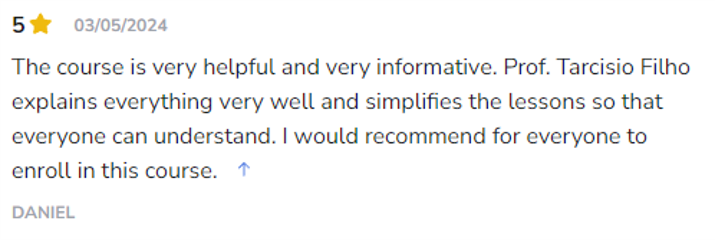
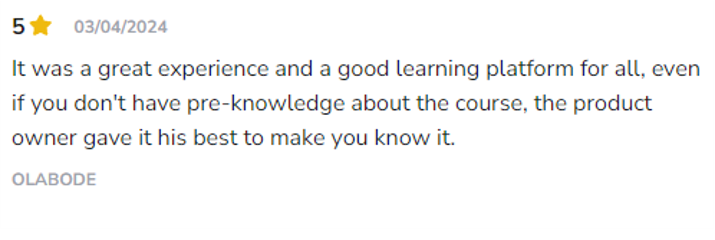
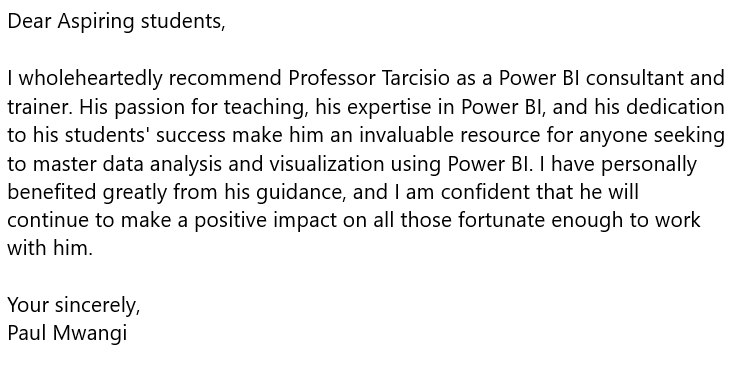
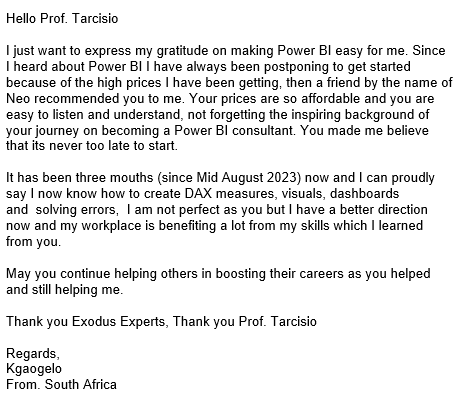
See some testimonials from my students.

Course Content
1.1 – Welcome – PBI Introductions – Live Class
1.2 – Installing PowerBI Desktop
1.3 – Creating a corporate account on PowerBI Online
2.1 – Understanding the data
2.2 – Importing Sales Data
2.3 – Creating the first visuals
2.4 – Exercise: Now it’s your turn to create other visuals
2.5 – Solution: Creating new visuals
2.6 – Importing and treating Targets Table
2.7 – How to deal with errors on PowerQuery
2.8 – Exercise: Your turn to transform a dirty base
2.9 – Solution: Transforming the dirty database
3.1 – Understanding the necessity of Data Models
3.2 – What are Dimension Tables and Fact Tables
3.3 – Creating the dCalendar table on PowerQuery
3.4 – Establishing relationship between dCalendar with Sales and Targets
3.5 – Creating the other dimensions on Power Query
3.6 – How tables behave
3.7 – Exercise: it’s your time to create a new Data Model
3.8 – Solution: Creating a new Data Model
[EXTRA] Live #2 – How to do a VLOOKUP on Power BI
4.1 – What’s the DAX Language?
4.2 – Creating Calculated Columns
4.3 – Creating Aggregation Measures (SUM and AVERAGE)
4.4 – Exercise: it’s your turn to create counting measures
4.5 – Solution: Creating counting measures (COUNT, COUNTROWS and DISTINCTCOUNT)
4.6 – Creating measure tables and formating measures
4.7 – Iterating measures (SUMX)
4.8 – Exercise: Testing your knowledge about the iterating functions
4.9 – Filtering measures with CALCULATE function
4.10 – OR condition on a CALCULATE function
4.11 – Removing filters with ALL
4.12 – Removing filters with ALLSELECTED
4.13 – Exercise: Testing your knowledge about ALL and ALLSELECTED
4.14 – Solution: Testing your knowledge about ALL and ALLSELECTED
4.15 – When to use CALCULATE + FILTER?
4.16 – Advanced example: SUMMARIZE + FILTER Functions
4.17 – Context change with CALCULATE
4.18 – Review: FILTER, ALL, VALUES and SELECTEDVALUE
4.19 – Time intelligence: Comparison with PREVIOUSMONTH and DATEADD
4.20 – Time intelligence: Comparison with PREVIOUSYEAR and SAMEPERIODLASTYEAR – Year over Year
4.21 – Time intelligence: Inventing a function for LASTWEEK
4.22 – Time intelligence: DATESYTD – Year To Date
5.1 – Principles of Data Storytelling
5.1.1 – Identify the purpose and the audience
5.1.2 – Draw a sketch
5.1.3 – Choose the right visuals
5.1.4 – Choose a theme and keep the standards
5.1.5 – Create a personalized background
5.1.6 – Consider using icons and images to help the user understanding
5.1.7 – Align the visuals and check the texts
5.1.8 – Pick references to inspire you
5.1.9 – Evaluate using Power BI features such as tooltips and drill-down options
5.1.10 – Collect feedback from users and improve the improvement points
5.2 – Which visuals to create?
5.3 – ETL: Targets 2023
5.4 – Creating new visuals Pt.1
5.5 – Creating new visuals Pt.2
5.6 – Adding background images to pages + Theme Customization
5.7 – Formatting the Dashboard
5.8 – Slicers and Filter Pane
5.9 – Adding text and icons
5.10 – Bookmarks and Selection Pane
5.11 – Creating the Cover and adding buttons
5.12 – Exercise: Create a Bookmark to hide/show a chart/table
5.13 – Solution: Create a Bookmark to hide/show a chart/table
5.14 – Details page with Drill-through
5.15 – Solution: Sales Details by Products
5.16 – Editing visuals interactions
5.17 – Tooltips
5.18 – Conditional formatting
5.19 – Formatting tables and matrices
5.20 – New Drill-Drown and Drill-Through with buttons
5.21 – Smart visuals: Key Influencers
5.22 – Smart visuals: Decomposition Tree
5.23 – Smart visuals: Smart Narrative
5.24 – Now it’s your turn to create a page by yourself
6.1 – Publishing the Dashboard
6.2 – Publishing it publicly on the web
6.3 – Licenses and prices
6.4 – Creating Workspaces and listing the existing permissions
6.5 – The safe way of sharing
6.6 – Private link + SharePoint + Teams
6.7 – Publishing Application
6.8 – Gateway Installing and setting up the automatic refresh
6.9 – Static RLS (Row-Level Security)
6.10 – Dynamic RLS Pt. 1 – Filtering Sellers
6.11 – Dynamic RLS Pt. 2 – Filtering Managers
7.1 – Intro
7.2 – What’s a Project?
7.3 – Agility Concepts
7.4.1 – Selling a project
7.4.2 – Example of Scope Definition
7.5 – Power BI Solution: Understanding the actual state
7.6 – Power BI Solution: Planning
7.7 – Power BI Solution: Executing
7.8 – Power BI Solution: Validating the solution
7.9 – Power BI Solution: Delivery and maintenance
7.10 – Final thoughts
32-hour course
- 16 hours of content
- 16 hours of exercises
Get this certificate now
 Verifiable in the blockchain of www.certify.one for you to share on LinkedIn and with Recruiters.
 Signed by Prof. Tarcisio de Oliveira Filho, a Microsoft Certified Trainer and Power BI Data Analyst, recognized worldwide.
Special offer
Complete Course
Career Boost With Power BI
$399.00
$ 327 USD
for 12 months of access
- +16h of Power BI Classes
- +16h of Practical Exercises
- Databases for exercises included
- Online Support for doubts via Hotmart
- Certificate - Advanced Power BI Course
- Introduction course to Figma - UX (User Experience) Design Tool
- Exclusive Premium Library of Background Templates on PowerPoint (10 projects)
- How to crack recruitment processes
- Live Q&A Sessions on Zoom every month
- Power Automate - From Zero to Hero
- Library of Dashobards made on Power BI

Unconditional guarantee of 07 days
You don’t need to explain why.
You can just ask for your money back on Hotmart and receive it if you don’t like my course.
FAQ
Yes! I will teach you everything from ZERO and you don’t need to buy a Power BI license.
The course is completely online and all lessons will be available for you to attend whenever you want, for up to 12 months. After this period, I send you an email asking if you want to renew for a small price.
12 months.
I am constantly updating and adding new content, and furthermore Power BI releases a new version every month, so we always have something to update.
In the period of the first 07 days, If you don’t like my course, you can ask for your money back on Hotmart and receive 100% back very easily, without having to explain why.
Yes, Hotmart will issue a digital certificate when you complete 100% of the course.
The course is extremely hands-on and I’ve organized it to go straight to the point to what most professionals need to learn in order to apply Power BI quickly in their jobs and career.
YouTube videos are very interesting for you to receive extra tips or learn some specific solutions and tricks, but they will not let you learn in the most optimal path and sequence. Furthermore, with years of experience, I bring actual insights from my real projects and clients’ opinions.
I believe the way I teach and my experience in real projects can bring a unique way of learning for you, going straight to the point and doing everything with purpose of working in a smart way and to bring value for your company and career.
The teachings about career with Power BI are something you won’t learn from most of the YouTubers. I believe I do not only teach how to click on buttons, I teach how to think strategically.
I will tell you something for your OWN benefit:
Buy the course and take all the classes in less than 07 days and then ask for your money back.
This offer expires in: